Collaborative Visual Analytics
Exploring and making sense of data with others

Many situations involve studying, exploring, and understanding data (and frequently communicating this understanding) with others. We envision digital workrooms that help support these processes. Our goal is to designi tools and interaction techniques that can support this interactive analytic process in such digital workrooms.
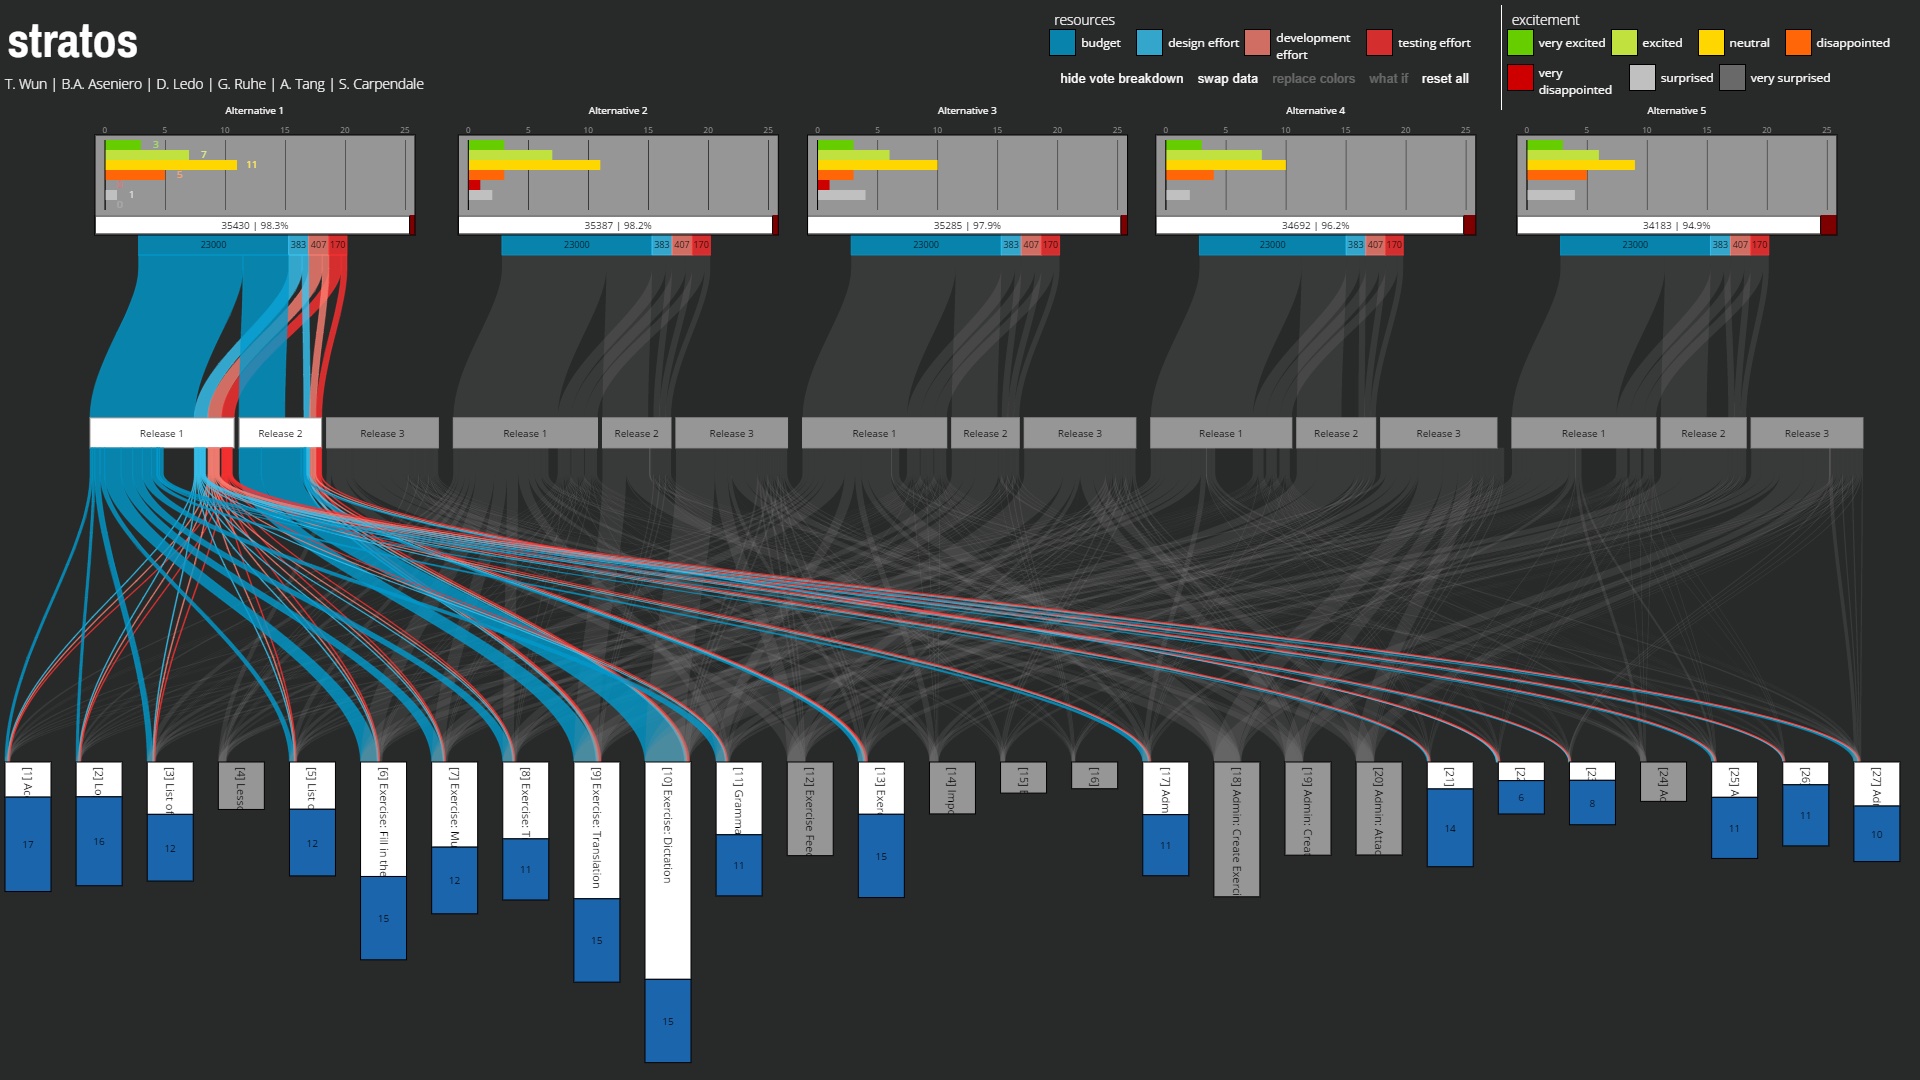
In this project, we have explored the fundamental mechanics of how people go about analyzing information and data (Isenberg, Isenberg, Hesselmann, Lee, Von Zadow, & Tang, 2013; Isenberg, Tang, & Carpendale, 2008), particularly given rudimentary tools (Tang, Tory, Po, Neumann, & Carpendale, 2006). We have imagined and explored next-generation interactive digital workrooms (Tang & Irani, 2011), and have built domain-specific tools to study how people analyze data with such tools (Aseniero, Wun, Ledo, Ruhe, Tang, & Carpendale, 2015). Finally, we have built tools to study how people are analyzing data, and making use of space and tools (Marquardt, Schardong, & Tang, 2015; Tang, Pahud, Carpendale, & Buxton, 2010).
Publications
Nicolai Marquardt, Frederico Schardong, and Anthony Tang. (2015). EXCITE: EXploring Collaborative Interaction in Tracked Environments. In INTERACT 2015: Proceedings of INTERACT 2015 - 16th IFIP TC 13 International Conference, 89–97. (conference).
Acceptance: 93/319 - 29.6%.
Bon Adriel Aseniero, Tiffany Wun, David Ledo, Guenther Ruhe, Anthony Tang, and Sheelagh Carpendale. (2015). STRATOS: Using Visualization to Support Decisions in Strategic Software Release Planning. In CHI 2015: Proceedings of the 2015 SIGCHI Conference on Human Factors in Computing Systems, ACM, 1479–1488. (conference).
Petra Isenberg, Tobias Isenberg, Tobias Hesselmann, Bongshin Lee, Ulrich Von Zadow, and Anthony Tang. (2013). Data visualization on interactive surfaces: A research agenda. Computer Graphics and Applications, IEEE 33, 2: 16–24. (journal).
Anthony Tang and Pourang Irani. (2011). Interstitial Space in MDEs for Data Analysis. In DEXIS 2011 Workshop on Data Exploration for Interaction Surfaces - Workshop at ITS 2011. (Isenberg, Petra and Carpendale, Sheelagh and Hesselmann, Tobias and Isenberg, Tobias and Lee, Bongshin, Eds.) (workshop).
Anthony Tang, Michel Pahud, Sheelagh Carpendale, and Bill Buxton. (2010). VisTACO: visualizing tabletop collaboration. In ITS ’10: ACM International Conference on Interactive Tabletops and Surfaces, ACM, 29–38. (conference).
Petra Isenberg, Anthony Tang, and Sheelagh Carpendale. (2008). An exploratory study of visual information analysis. In CHI ’08: Proceedings of the SIGCHI Conference on Human Factors in Computing Systems, ACM, 1217–1226. (conference).
Anthony Tang, Melanie Tory, Barry Po, Petra Neumann, and Sheelagh Carpendale. (2006). Collaborative coupling over tabletop displays. In CHI ’06: Proceedings of the SIGCHI Conference on Human Factors in Computing Systems, ACM, 1181–1190. (conference).